


The price-to-earnings ratio (P/E ratio) is a valuation metric used by investors to get an idea of whether a stock is over- or undervalued. But understanding what is a “good” P/E ratio for a stock requires additional context.
Let me explain.
P/E ratio alone isn’t useful. It’s best used as a relative metric i.e. when comparing P/E ratios between similar companies operating within the same industry. This is one of the most common types of fundamental analysis.
Is a High PE Ratio Good or Bad?
If you were wondering “Is a high PE ratio good?”, the short answer is “no”.
The higher the P/E ratio, the more you are paying for each dollar of earnings. This makes a high PE ratio bad for investors, strictly from a price to earnings perspective.
A higher P/E ratio means you are paying more to purchase a share of the company’s earnings.
So, what is a good PE ratio for a stock? A “good” P/E ratio isn’t necessarily a high ratio or a low ratio on its own.
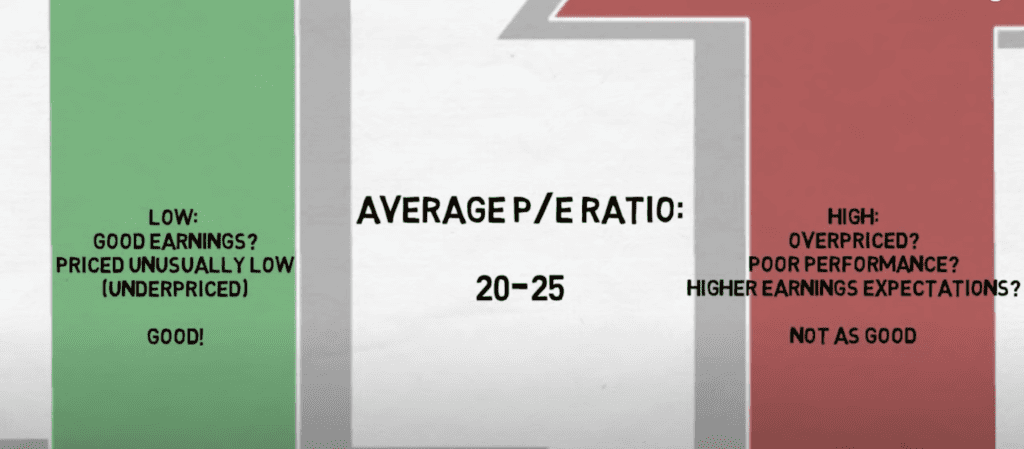
The market average P/E ratio currently ranges from 20-25, so a higher PE above that could be considered bad, while a lower PE ratio could be considered better.
However, the long answer is more nuanced than that.
A high P/E ratio, whether compared to the industry average or its historical average, means you are paying more for each dollar of earnings, but it also implies that investors are expecting the company to grow earnings faster in the future, whether it be versus its competitors or its own past growth. Having someone to help you with these will be easier for you to comprehend. However, choosing a professional consultant to guide you with these will be difficult if you don’t understand the difference between an accountant and a bookkeeper.
P/E Ratios Are Only Useful Compared to a Benchmark
A P/E ratio of 10 might be pretty normal for a utility company, while it might be exceptionally low for a software business.
That’s where the industry PE ratios come into play. What’s the expectations of the company relative to its major peers and competitors?
That’s a question that can be answered by comparing a company’s P/E ratio to its industry or historical pe ratios.
A stock market index, such as the S&P 500, can be used to gauge whether the company is over- or undervalued relative to the market.
A P/E ratio can also be benchmarked relative to the industry average P/E, such as comparing McDonald’s to the average P/E ratios of other fast food restaurants.
You can get industry P/E ratio data at WallStreetZen.com. Unlike most stock research websites that just show you P/E ratio as a single number, WallStreetZen shows you the average market P/E ratio, as well as the P/E ratio of the company you’re researching.
In this example from McDonalds (NYSE: MCD), we can see how comparing PE ratio with benchmarks helps us determine whether a PE ratio is relatively good or bad.
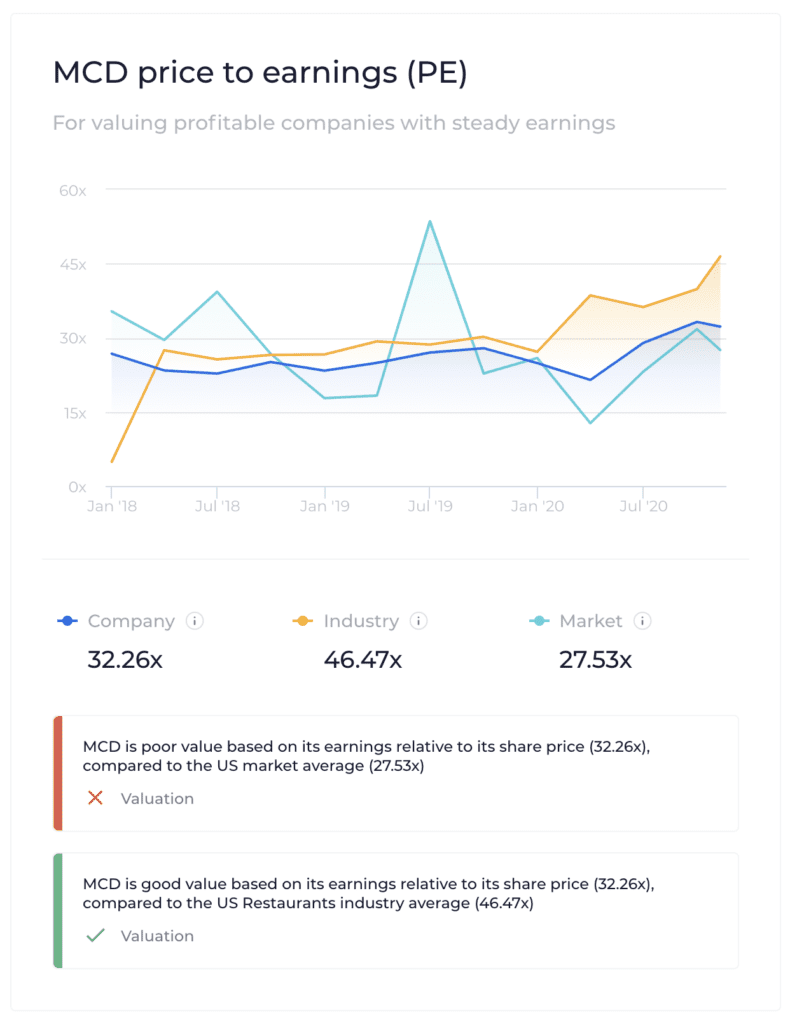
Source: WallStreetZen.com
This chart from WallStreetZen shows us Mcdonald’s P/E ratio over time, compared to two important benchmarks – the US market P/E ratio average, and the US restaurant industry P/E ratio average.
What’s unique here is that WallStreetZen also runs automated due checks that compare McDonald’s P/E ratio with the US market average and the US Restaurant industry average, and gives you the results in simple, one-line explanations.
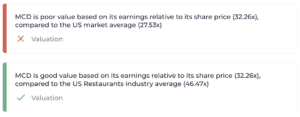
In the example above, we can see that Mcdonald’s is poor value relative to the U.S. market from a P/E perspective, but good value relative to the US Restaurant industry.
You can try heading over to WallStreetZen and searching for stock you’re interested in to see how its P/E ratio compares with the industry / market.
How Industry P/E Ratios Work
Industry PE ratios are the average (mean) P/E ratio of all the companies that operate within a certain industry.
For example, the industry P/E for US auto manufacturers would include the average P/E ratio of Ford (NYSE:F), General Motors (NYSE:GM) and Toyota (NYSE:TM), among many others.
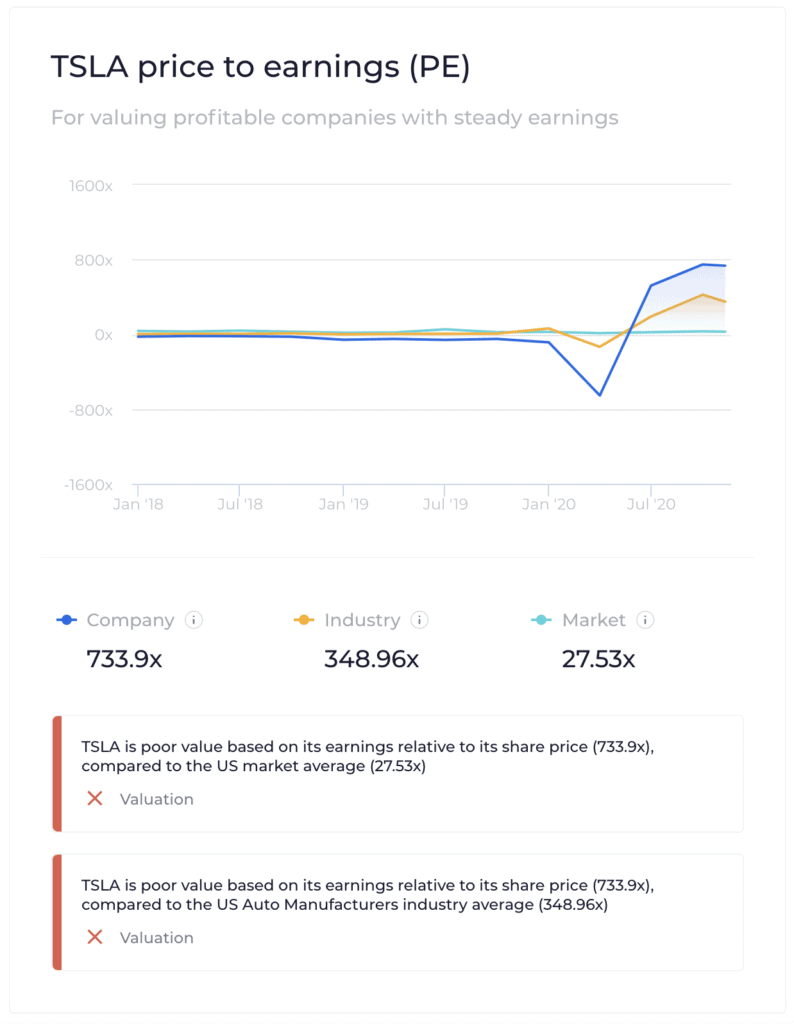
If we were to look up the P/E ratio of Tesla (NASDAQ: TSLA), we would want to see how it compares to its peers.
Source: WallStreetZen.com
In the example above, we can see that investors are willing to pay more per earnings per share for TSLA, compared to other US automobile manufacturers. If you view Tesla as a promising company disrupting the automobile industry that will continue to take market share from its competitors (like the folks at manufacturing.net), then paying a higher price may make sense.
However, if you’re a skeptic, you would view Tesla as grossly overvalued based on its high price to earnings ratio. It’s often the case that companies have more a reasonable P/E ratio when they first become public — if you love Tesla and Elon Musk, you may want to keep an eye on the return of Twitter stock to the public market.
Price To Earnings Tells You How Expensive a Stock Is, Relative To Other Stocks
Stock price alone has nothing to do with how “expensive” a stock is—shares of Booking Holdings (BKNG)—owner of sites like Priceline and Booking.com—trade for nearly $1,400.
However, it’s not as expensive as other top travel website stocks. Booking Holdings has a P/E ratio of 12. Keep that in mind.
Meanwhile, shares of Expedia (EXPE) trade for less than $70 a piece. But its P/E ratio is 18. Then there’s TripAdvisor (TRIP), which trades at $18 a share, yet has a P/E of over 20.
So, while you have to pay $1,400 to buy one share of Booking Holdings stock, you’re effectively only paying $12 for $1 stake in the company’s earnings, given its P/E is 12. For TripAdvisor, you’re paying $20 for a $1 earnings stake.
Now, the reason you’re paying more for TripAdvisor is because investors believe it will grow earnings faster in the future.
The industry P/E ratio for Booking Holdings would include all its major peers and competitors. The travel and leisure industry P/E is roughly 19.
Based on Booking Holdings 12 P/E, the company is expected to grow its earnings at a rate below the travel and leisure industry. Whether that will happen or not is something you have to decide for yourself.
If you believe the market is missing something and that Booking Holdings is well positioned to take market share from a competitor then the stock could be considered “undervalued.”
Industry P/E Ratios for Individual Stocks
Different industries have different P/E ratios that are considered “normal.”
For example, some industries trade at an average of 15 times earnings, while others trade at 30 times. It’s because some industries have different expectations.
Utility companies tend to have lower P/E ratios given their low historical earnings. Meanwhile, technology companies have enjoyed higher P/E ratios due to their higher earnings growth.
Consider this, during the Great Recession technology stocks had lower P/E ratios than consumer staple stocks. That’s because investors expected consumer staples, like toothpaste and groceries, were expected to outperform tech stocks in the near-term.
How to Calculate the P/E Ratio
The easy way to think about P/E ratio is—it’s what you’d pay for $1 of a company’s earnings. The formula for P/E ratio is:
Price-to-Earnings (P/E) Ratio = Stock Price / Earnings Per Share (EPS)
Most financial websites openly publish the P/E ratio, so you don’t have to calculate it from scratch. However, understanding where they are getting the numbers is always useful.
A P/E ratio includes a company’s stock price, which can be found in any number of stock research websites. But when it comes to the earnings per share (EPS) part, some sites and sources use the trailing twelve months’ (TTM) earnings, while others stick to the fiscal year—which many times ends on Dec. 31, but can end on other dates.
So if a stock is trading for $20 a share and made $2 in EPS over the trailing twelve months, its P/E ratio is 10, ($20 / $2).
A company’s earnings is its net income. Earnings per share (EPS) is the company’s net income divided by its total shares outstanding. (Note for dividend investors: Earnings are calculated before dividend payments are distributed)
For example, to calculate Microsoft’s P/E ratio, you’d first need to calculate Microsoft’s earnings per shares.
For the trailing twelve months (TTM), which is the four most recent quarters of reported financials, Microsoft has posted EPS of $5.36. Its shares outstanding is 7.673 billion. As of Apr. 25, 2020, Microsoft’s stock price is $174.55. Thus, its P/E ratio is 32.57 ($174.55 / $5.36).
However, that number by itself tells us little about Microsoft’s valuation or prospects.
What the P/E Ratio Tells You
The P/E is meant to be a quick way to assess a company based on its earnings.
A high P/E ratio relative to its peers, or historically, means investors are expecting higher future earnings growth, and thus are willing to pay more right now. A lower P/E suggests investors believe earnings growth may slow going forward.
For example, Amazon stock has a P/E of over 100 as of April 2020. Compared to other online ecommerce companies, this is high, meaning investors believe the company’s earnings growth will outpace peers in the near-term.
The P/E ratio, in simplistic terms, is how much one dollar of profits cost to invest in the company. In the Amazon example, an investor is effectively paying $100 for every $1 of profits.
Again, the P/E ratio, sometimes referred to as the earnings multiple, is not a good measure of value on a standalone basis. Instead, it’s best used when compared to the industry average or its historical average P/E ratio.
Understanding “what is a good PE ratio for a stock” starts with comparing the P/E ratio to a benchmark. The P/E ratio is meant to display how “expensive” a stock is relative to its peers (industry) or itself (historically).
Read more: What Is a Good ROE (Return on Equity) and Why Is It Warren Buffett’s Most Important Number?
P/E Ratio and Investor Expectations
P/E ratios are mostly about investor expectations. A stock with a low P/E ratio suggests a company’s profits are expected to decline in the future. A high P/E suggests profits will rise.
Earnings can rise or fall for a variety of reasons, maybe the company is facing increased competition or maybe a new technology is making its products obsolete.
Earnings are how a company is doing. The P/E ratio is how the company is expected to do.
Absolute vs. Relative P/E
A relative P/E ratio is a P/E that is benchmarked.
That is, the P/E ratio is compared to the industry average or historical pe ratios for individual stocks.
Relative P/E is the company’s P/E ratio divided by the chosen average. It’s displayed as a percentage.
For example, the median P/E ratio for Amazon over the last 13 years is 145. Its current P/E ratio is 103, which means its relative P/E based on its historical average is 71%.
How to Analyze Historical PE Ratios
Historical PE ratios are often used with the S&P 500 when doing a technical analysis on trends and deciding whether the overall market is “expensive” or “cheap.”
For example, the current P/E ratio of the S&P 500 is around 20. The historical average for the S&P 500, dating back to when the index was created in the 1800s, is around 16.
Here’s a historical chart of the S&P 500.
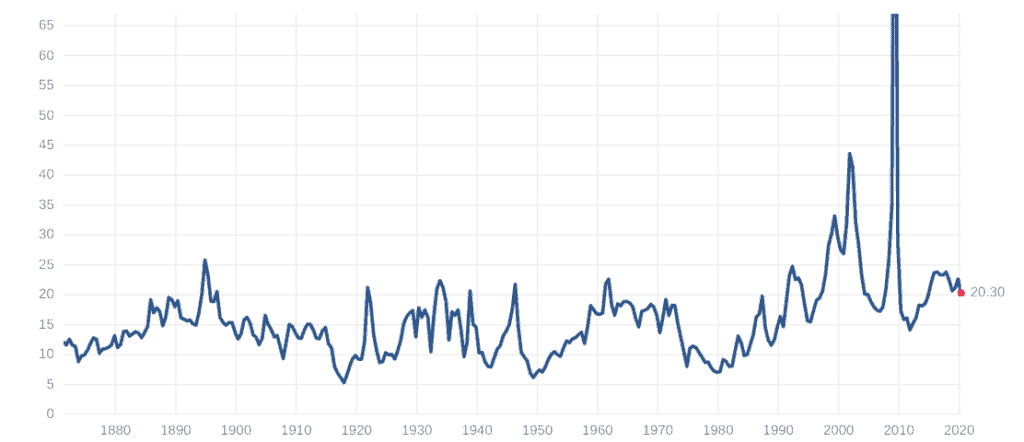
Source: Multpl
The P/E ratio had a low of nearly 5 in 1917 and hit a peak of 124 in 2009.
Based on the historical average, the S&P 500 is slightly overvalued today. That is, the economic and earnings outlook for the S&P 500 is expected to be below historical norms.
When the economy is booming, P/E ratios will be higher than average, and vice versa when the economy is on rocky ground.
This same concept can be applied to industries and individuals stocks. The historical average, which can span several years or decades, is calculated and then compared to the current company or industry pe ratios.
Trailing P/E vs. Forward P/E
The forward P/E ratio is different from the typical (or trailing) P/E ratio.
The typical P/E ratio uses the most recent earnings for the trailing twelve months, hence it’s called the trailing P/E ratio. The forward P/E ratio uses future earnings expectations for the next year.
The downside to using future expected earnings is that earnings expectations might be downplayed by the company. The company may make estimates that are on the low-end to be able to beat earnings expectations.
For a trailing P/E ratio, the issue is that past performance doesn’t mean the same performance will be enjoyed in the future.
Still, if the forward P/E is lower than the trailing P/E then the market expects earnings to increase in the future. If the forward P/E is higher, earnings are expected to fall.
Using the P/E Ratio to Value a Stock
P/E ratios can be used for valuations and identifying the best stocks to buy. In fact, it’s one of the most widely used ratios when analyzing a stock’s value.
P/E vs. PEG Ratio
As mentioned, the P/E ratio alone cannot be used to assess companies.
One variation of the P/E ratio is the price-to-earnings to growth ratio, also known as the PEG ratio. The PEG ratio is calculated as the trailing P/E ratio divided by the future expected growth rate.
The PEG ratio takes into account the current earnings and the expected growth.
A PEG ratio of 1 or less is generally considered an undervalued investment because its price is low compared to growth expectations.
PEG ratios can be forward or trailing as well. Forward PEG ratios use the expected earnings growth rate for a period of time—usually five years. Trailing PEG ratios use the previous five years.
For example, Apple stock has a P/E ratio of 23.3. Its earnings growth rate for the next five years is 12.6% annualized. Thus, its forward PEG ratio is 1.85, or 23.3 / 12.6. Tech stocks have good P/E ratios because of their product releases. Another good example is Sony which gets a lot of its revenue from consoles, especially its PS5 which remains out of stock.
P/E vs. Earnings Yield
Another way of thinking about the P/E ratio is the earnings yield. The earnings yield is inverse of the P/E ratio—which is calculated as earnings per share divided by price per share.
The earnings yield is displayed as a percentage and allows investors to compare a stock to other assets, such as fixed income securities.
Consider this, the earnings yield for McDonald’s is 4.2%, or its EPS of $7.88 divided by its stock price of $187. Meanwhile, its P/E ratio would be 23.7, or $187 / $7.88.
This can then be compared to the return of an asset like the 30-year Treasury bond, which offers a yield of 1.28%.
Shortfalls of P/E Ratios
The P/E ratio for all its usefulness also has its shortcomings.
Firstly, companies that make no earnings have a “0” or “N/A” P/E ratio. If earnings are negative, the P/E ratio can be calculated, but a negative P/E ratio is generally not useful for comparison purposes.
The P/E also can’t be used to compare companies of different industries. As a standalone metric, the P/E ratio may fail to reveal other issues, such as high debt levels.
As well, earnings can be manipulated to downplay expectations or to make the numbers look better. This can skew the P/E ratio.
Finally, the downside to the P/E is that just because the P/E ratio suggests a stock is “cheap” doesn’t mean the investor should buy it. The company could be cheap for a reason, such as the number of customers are in decline.
So ultimately, the answer to the question “what is a good PE ratio for a stock?” is that – like all financial ratios, the P/E ratio is just one indicator that needs to be used in context with other data points and fundamental research in order to make an intelligent investment decision. This is the same if we ask “what is a good ROE“, or “what is a good P/B”, or what is the best entry point of the trade.
Using a stock screener can be a good way to narrow down the universe of stocks by a variety of ratios and metrics, including P/E ratio.
Want to learn more about fundamental analysis? Read this article on How to Know What Stocks to Buy?
Interested in IPOs? Learn how to buy SpaceX stock or how to buy TikTok stock.