
It’s definitely up there as one of the best!
Based on my experience, Finviz is one of the most informative stock analysis and research tools available. The vast amount of statistical information available for free is unmatched. There are no bells and whistles, just screens and screens of financial data, charts and statistics. This stock market portal offers so many excellent features including stock screeners, news feeds, portfolio management, stock charts, and many other detailed tools for trading.
Finviz can be easily used by both casual and professional investors wanting specific data about the US stock market.
In this article, I’m going to provide a comprehensive Finviz review and also draw some comparisons with my preferred, and also a much more beginner-friendly, research tool, WallStreetZen. It is important to find a stock screener that works best for you in order to be successful, and these two stock research tools are each great in their own ways.
What Is Finviz?
The Finviz stock screener offers users very informative data about the US stock market and comes in two forms: free and Elite.
One difference between the two is that the free version has pop-up ads while the Elite version does not. (Side note: these pop-ups are not overly annoying, so switching to Elite would be most beneficial to day traders for reasons that I’ll go over later.)
The extensive market data that Finviz offers makes it a very valuable tool, even the free version. However, its comprehensive charts and screening options can be overwhelming for a newcomer, so on occasion I’ll suggest WallStreetZen as an easier-to-use alternative for the part-time investor.
In this Finviz review, I’m going to break down this site for you by explaining each feature, share the pros and cons, and tell you the added bonuses of purchasing the Elite version.
The Finviz Homepage: Data At A Glance
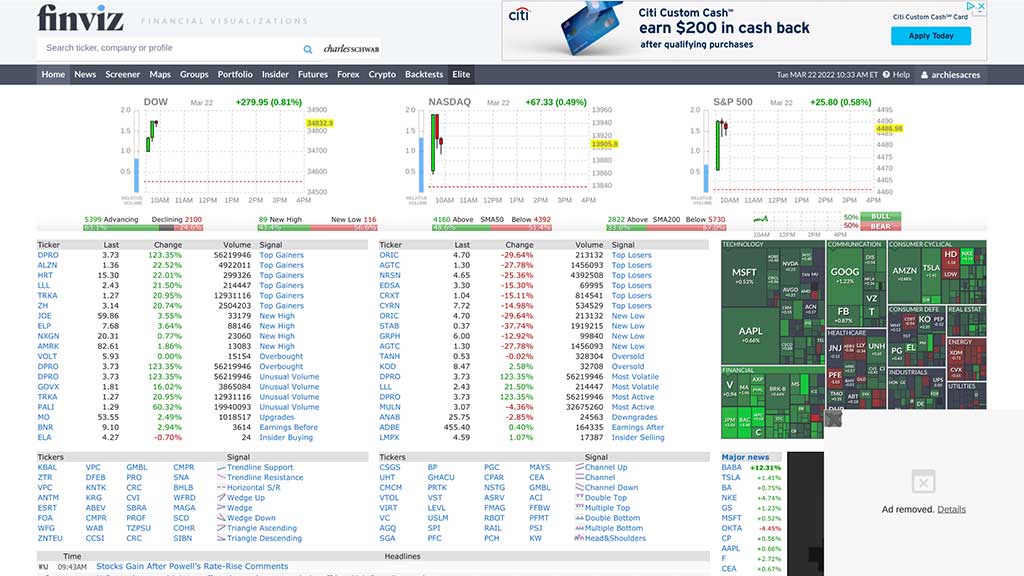
The Finviz homepage is instantly helpful and chock full of information, with graphs and charts that indicate how major indices are performing, similar to tools like Trading View (see a review of Trading View here), as well as the top stock gainers and losers of the day (gainers and losers are also available on WallStreetZen.)
The homepage also shows a list of stocks where Finviz has detected a technical signal such as insider buying, unusual volume, a lot of volatility, a new low, if a stock is oversold, and more. This feature is great because it helps users zero in on stocks with the best statistical setup for a trade.
The homepage instantly provides a wealth of information and it only gets more informative as you open more tabs.
There is also a small map on the right side of the screen that shows several industries and sectors in the S&P 500 index. This visualization is a helpful way to assess how the markets are behaving by displaying which industries are experiencing the most activity. A snapshot of the Finviz homepage is shown here.
Current Market News on Finviz
The next tab, to the right of the homepage, is the News. This page is split between news reports and blog posts that are monitored for accuracy.
On the main News page, you will see the most recent news and articles about the market. At the top of the page, you can narrow down the news and posts on a specific company. This is very useful for keeping tabs on the media health of your own investments.
The Finviz Stock Screener
Now, here is where Finviz really excels and I say makes it one of the best stock analysis tools available today. The Finviz stock screener is incredibly fast and powerful and offers very specific and in-depth search options.
This section is going to be the longest because there is a lot to cover.
The Finviz screener offers three different types of filters: Descriptive, Fundamental, and Technical.
The Descriptive filters are the basic set of filters offered on exchanges, such as market cap, dividend yield, earnings date, average volume, industry, price, country, etc. These filters are the first ones used to narrow down your search.
The second set of filters are called Fundamentals, and they go into even greater detail about the stocks. The user can filter tickers based on the basic P/E ratio, margins, sales growth quarter to quarter, EPS growth, insider ownership, and many more. P/E ratio data is important because it shows how a company is expected to perform in the future.
The third filter option are the Technical filters such as moving averages, gap, RSI, volatility, performance, percentage change, after-hours change, and so on. This page also includes candlestick and patterns.
Once you’ve narrowed down your stocks with the Descriptive, Fundamental, and Technical filters, you can view the results in 13 different ways:
- Overview – the most general information such as company name, sector, price, market cap, P/E, % change, and volume
- Valuation – a variety of derived ratios about each stock
- Financial – information on gross margins, profit margins, earnings, dividend yield—basically, all the important financial indicators
- Ownership – details on institutional ownership, short ratio, institutional ownership, outstanding shares, etc.
- Performance – an informative overview of past performance as well as volatility and volume information
- Technical – a display of technical indicators including RSI, 20-, 50- and 200-day simple moving averages, and 52-week lows/highs (the best volume indicator for day trading)
- Charts – display of technical patterns that will give you visual information about stocks in your search criteria, which is a great way to analyze a large number of stocks at once
- Ticker – a visual representation of tickers based on their performance (If you hover over each ticker, a small chart will appear with more detail)
- Basic – both a technical chart and a small table with company fundamentals, side by side, for each stock
- TA – similar to the Basic tab, where we see a technical chart and a small table with technicals side by side, but focused more on stock performance
- News – recent news on each stock
- Snapshots – basic company profiles and insider trading information
- Custom – allows you to choose what you want to see and save that view
As you can tell, the Finviz stock screener is very complex and therefore can be intimidating for many users who are new to stock trading.
After testing this stock screener for some time, I’d say an easier and less overwhelming alternative for those not wanting to do the complicated work would be the WallStreetZen stock screener. The layout of this app is much simpler and breaks down all of this information in a very easily understandable way. For example, they offer a general stock screener where stocks are listed by market cap and can be filtered and sorted in any way the user prefers.
A snapshot of their stock screener page can be seen below.
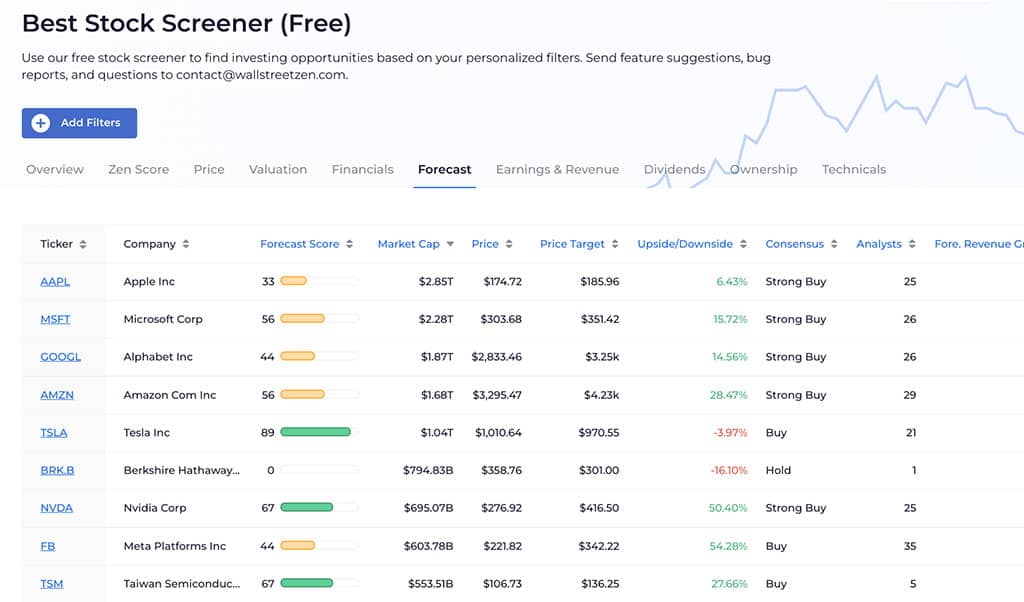
With WallStreetZen, you can enter a company ticker that you want to learn more about. This super user-friendly site will bring you to an information page that includes basic details about the company you’re interested in and show you its stock price, market capitalization, revenue, and price-to-earnings ratio. WallStreetZen keeps things simple for the everyday investor.
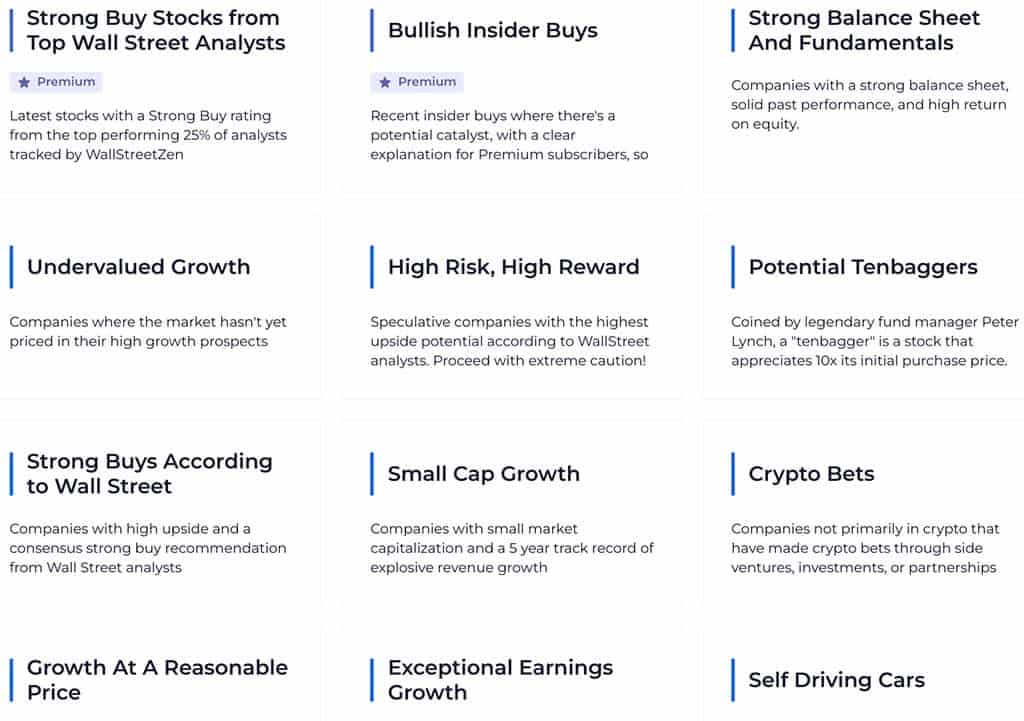
WallStreetZen also offers an entire library of “Stock Ideas” where they provide lists of stock recommendations based on screening criteria that’s important to investors.
These “pre-set” screeners make it easy for beginners to start screening for stocks, even if they’re not sure what screening criteria they should use, while helping advanced investors generate new ideas quickly. These ideas range from the latest strong buys according to analysts, top stock gainers and today’s biggest decliners, the best penny stocks to buy based on quant factors, and much more.
Finviz Maps
The Maps tab is a wonderful feature in Finviz. This tool shows the price changes of stocks per sector and industry in graph form. The size of each box represents the market capitalization of those stocks, sectors, and industries relative to one another.
The maps can be changed to show data from specific time periods, to show details about volume, P/E, PEG, earnings, and much more. This is a great free visual resource.
Finviz Groups
Moving on from Maps, the Groups tab provides another view of stocks by sector, market cap, or industry. When looking at an individual stock, it’s important to consider how its group is performing. That allows us to understand where assets are positioned in relation to their peers by evaluating performance and valuation.
This visualization can be narrowed down to a particular period of time and is extremely helpful for reading current market conditions across different industries and sectors.
Finviz Portfolio
The Portfolio tool on Finviz is an excellent feature, and it’s also free and accessible when you create an account. Users can insert which stocks and ETFs they buy or sell, the date that transaction happened, and at what price, in order to build their portfolio. Finviz will then keep track of overall price movement and changes to every stock added.
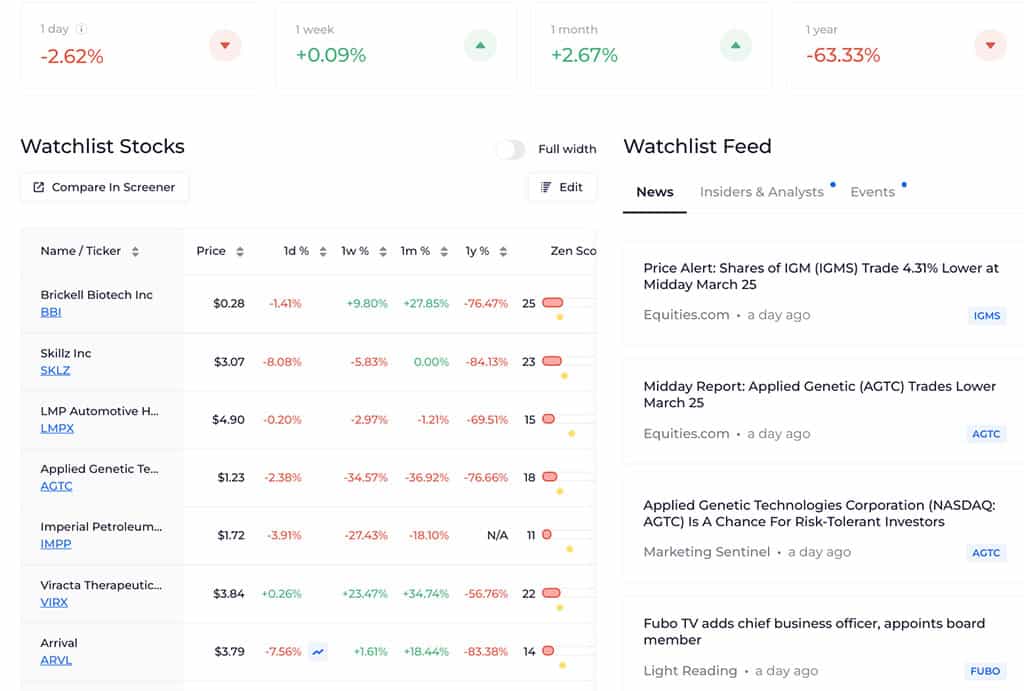
By comparison, WallStreetZen does not have the same portfolio tracking option. However, the tool does provide a helpful Watchlist and will update you on specific stocks that are moving or making news.
Finviz Insider
The Finviz Insider trading tab keeps track of all transactions made by executives and directors at publicly listed companies.
Insider trading speaks volumes about how executives perceive their own companies’ stock. If several executives are selling their own stock, that could be interpreted as a negative sign, while many executives purchasing more stock could be seen as a good sign.
Here’s a snapshot of the Insider tab. Purchases are highlighted in green, options are white, and sales are indicated by the red highlight.
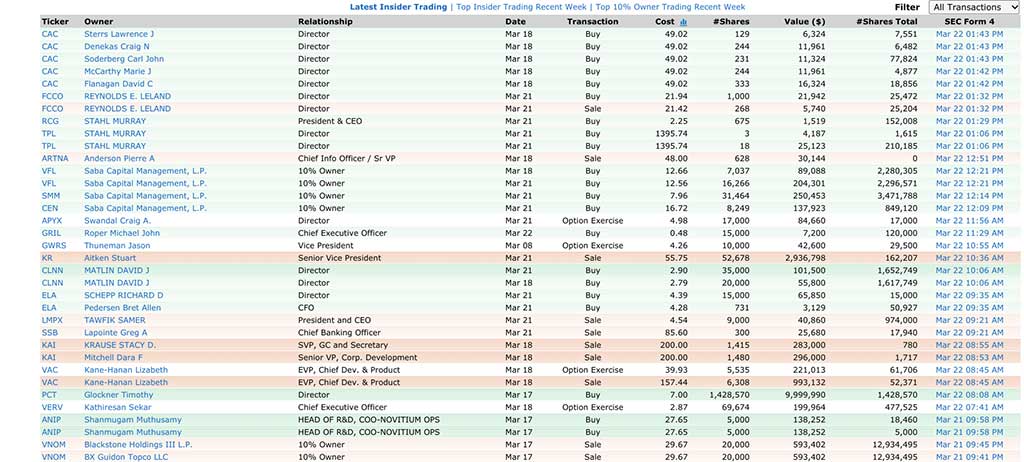
This is the generic screen; however, a specific stock can be specified in the search bar.
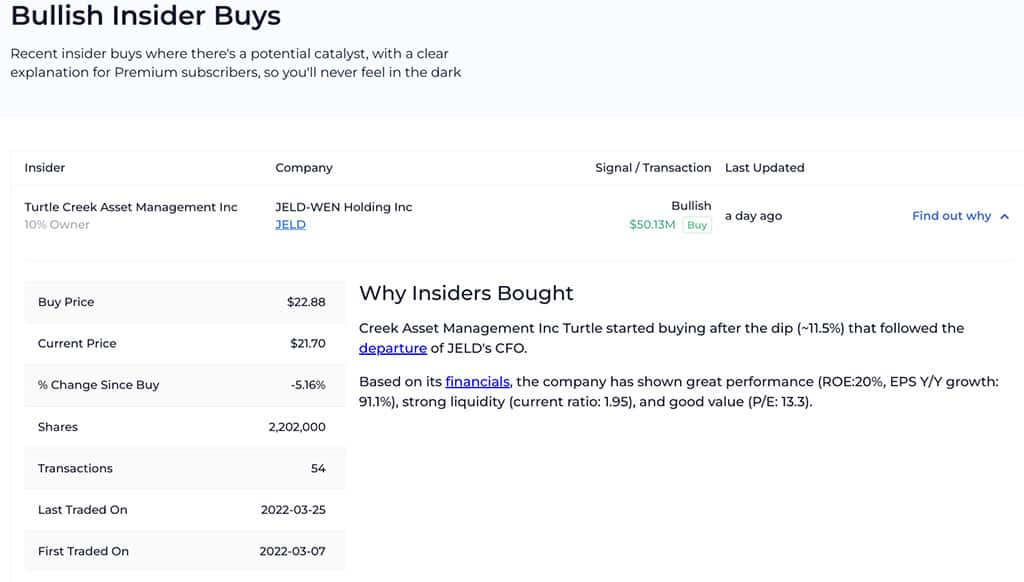
The WallStreetZen app does not have a general insider trading page in the same way that Finviz does, with insider trading activity happening in the market at any moment. Instead, WallStreetZen will provide valuable insider trading info when you are researching a specific stock. They also have a Premium page where they analyze insider buys each day and identify catalysts for these transactions. This information can often signal a big investment opportunity.
Finviz Futures, Forex & Crypto Tabs
The Finviz Futures, Forex & Crypto tabs are all very similar visually, so I’m going to describe them as a group.
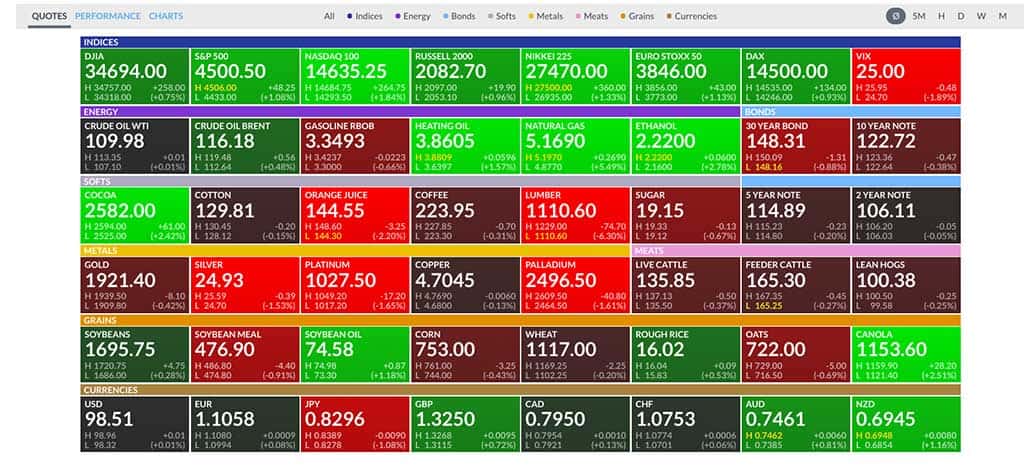
The Futures tab shows prices and charts covering the futures market by highlighting prices in the indices, energy, bonds, softs, metals, meats, grains, and currencies sectors. This information can be displayed in different chart formats that are very easy to follow and can be specified by a particular period of time.
Next, the Forex tab offers the same information about relevant currency pairs as the Futures tab does: EUR/USD, GBP/USD, CRUDE OIL, USD/CAD, gold etc. This tab shows you quotes, performance, and individual chart data in the same way as the Futures tab.
The third tab in this group is Crypto. In this tab, you can follow the price of Bitcoin (BTC), Litecoin (LTC), Ethereum (ETH), Ripple (XRP), and Bitcoin Cash (BCH) against USD, EUR, and BTC. These are considered the most relevant cryptocurrencies on the market right now. There are performance charts, quotes, and individual charts available on each of these cryptocurrencies.
If you’re looking for a way to invest in these assets, check out our iTrustCapital review for the best way to buy crypto in your IRA. You should also check out this review of the best laptops for crypto trading, which can further enhance your trading experience and provide the necessary tools for successful investing .
Finviz Assets Pages
You can get to an asset page by either clicking on stock listed anywhere on the website or by searching for the company on their incredibly fast search option.
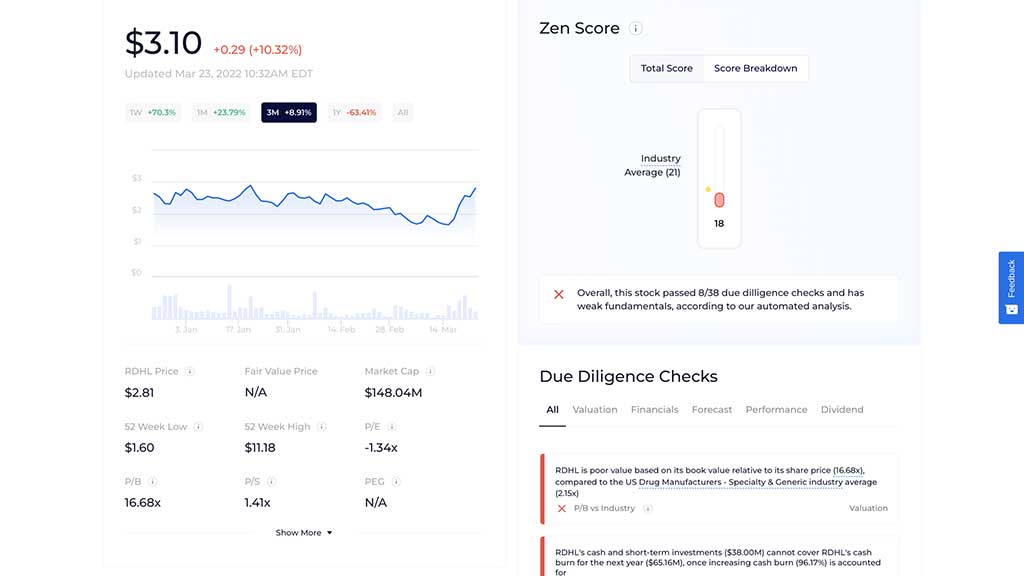
A stock’s profile page provides a wealth of important data such as technical charts, color-coded fundamental data, lists of analyst ratings, recent news, and insider trading information. All of this information is laid out in a very easy-to-follow format.
By comparison, the assets page in WallStreetZen has a nice layout as well. It reads very well on a mobile device and provides a lot of great data.
WallStreetZen also scores each stock based on Valuation, Forecast, Financials, Performance, and Dividend. The higher the score, the healthier the stock. This scoring feature is referred to as Due Diligence Checks and is very helpful in assisting the user in deciding whether or not to trade a stock. The assets page provides news, charts, and a Q & A section about the stock.
How Much Is Finviz?
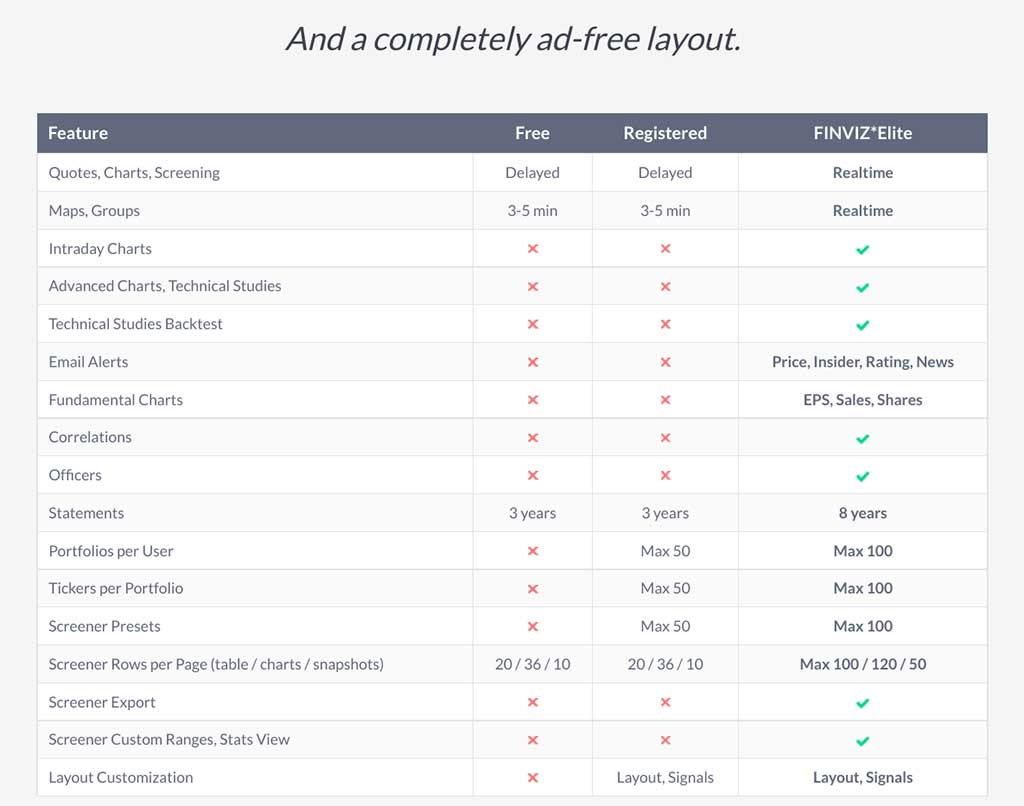
There are two plans to choose from: a free plan that includes pop-up ads and a paid, ad-free plan called Elite.
The free version offers most of the data and charts that a casual or beginner trader would need to be successful. However, there are a few important perks that come with the Elite version that a professional day trader would find vital.
You can choose to either pay monthly or annually for the Elite version: $299.50 annually or $39.50 per month at the time of this writing. An annual subscription will save you $174.50 per year.
WallStreetZen offers a free plan that is very informative in a mobile-friendly, uncomplicated way. They also offer a paid option called WallStreetZen Premium that has similar upgrades as Finviz Elite but without the overly complex charts or backtesting. WallStreetZen Premium is available for $150 per year, half the price of Finviz Elite.
How Good Is The Finviz Free Version?
The free Finviz tool provides an excellent stock screener, maps, groups, portfolio management tools, insider trading data, powerful search capability, and many other features. For a free app, it’s an amazing stock screener tool.
WallStreetZen is also an incredibly valuable free stock screening site. Its Zen scoring of each stock puts all the information found on Finviz into a very easy-to-read and easily digestible format. Basically, WallStreetZen does all the work for you.
Finviz Elite Review
Finviz Elite offers several great features besides the ad-free layout. By far the most important feature of Elite is giving users access to real-time data. There are no time lags on quotes, charts, or news with the Elite version. Elite users also gain access to extended trading hours.
With Finviz Elite, data charts are interactive and provide access to drawing tools, performance comparisons, overlays, data indicators, and Intraday charts. It gives other similar charting tools (like Trading View or Stock Charts) a run for their money. Elite users can customize any chart by type and time frame. And alerts can be created to notify the user of a stock or EFT reaching a certain specified point.
Finviz Elite allows users to backtest trading strategies. On the homepage there is a Backtest tab that is only accessible to Elite plan members. This allows users to evaluate trading strategies using 15+ years of historical data and over 100 indicators, before any money is actually spent. This is a great ‘What If’ tool for planning a portfolio.
An Elite subscription also gives users the ability to search for correlated or inversely correlated stocks, which is vital for diversifying risk. Finviz provides its users with proprietary correlation algorithms to help them adjust their portfolios in the safest way.
Additionally, the Elite plan gives users access to even more stock screening features such as the ability to export data, advanced charts, custom filters, and a statistics view.
Finally, an important feature for traders is the ability to receive alerts and notifications. This feature is included in the Elite plan. Elite subscribers can get price, news, updates, ratings, and events alerts emailed to them as the info breaks. Subscribers can also program specific stock criteria to receive alerts on new stocks that meet given screening information.
WallStreetZen Premium also offers the alerts option, to notify you with updated analyst stock forecasts, when insider trading happens, and upcoming dividend, earnings, and stock split news.
Is Finviz Elite Worth It?
I do think Elite is worth the price, especially for very active day traders who are moving a lot of money around. (You can check out this FinViz Elite review for a different perspective).
The free version of Finviz offers users an amazing amount of vital information, but its biggest downside is delayed data. Elite users, however, get up-to-date financial info in real-time, which is vital for quick transactions. The option for price alerts is a useful added bonus for Elite users, as well as the interactive charts. But again, the free version would suffice for most users.
Finviz Review: A Final Word
Finviz is by far one of the best stock screeners available, offering a large variety of information in many different ways and with informative maps and charts.
The site offers:
- Specialized news on each stock
- Inside trading information
- Analyst ratings and map visualizations of stocks by sector
The free version of Finviz offers users a very large swatch of useful information, along with the stock screener. Along with real-time data, the Elite subscription gives users the added ability to utilize backtests and correlations, use advanced charts, set stock alerts, and search stocks matching specified patterns.
Finviz does have a few cons:
- The market data only covers US exchanges
- This site clearly caters to stocks as there are few details on ETFs
- The site is not mobile-friendly
This is where WallStreetZen really shines, offering a very easily navigated, user-friendly mobile app to take with you on the go.
While Finviz is just what a well-versed, advanced trader would need, WallStreetZen is a great stock screener for a part-time investor or true trading newcomer.
WallStreetZen also has a great blog where they have many review-type articles (just like this one!). Check out their Motley Fool review, Seeking Alpha review, Morningstar review, Zacks review, or the one review that compares all 4 (Motley Fool vs Zacks vs Morningstar vs Seeking Alpha).


