


Studies show that beating the market is incredibly hard, even for professionals.
New investors will get a better return by simply investing in low-fee index funds or mutual funds that track the market, rather than attempting to beat the market by picking individual stocks.
Studies also show that even experienced investors are generally better off allocating the majority of their portfolio to low-cost index funds/mutual funds that track the market.
However, if you are an experienced investor who chooses to allocate a percentage of their portfolio to researching and investing in individual stocks, read on!
“Price is what you pay. Value is what you get.” – Warren Buffett
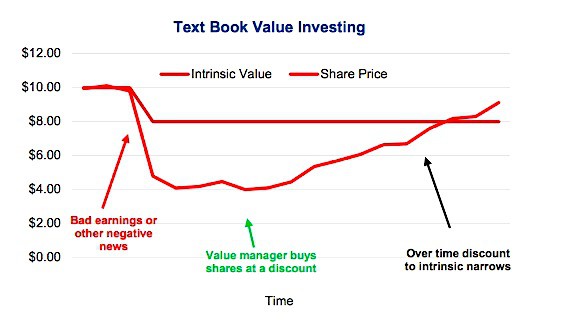
Value investing is one of the primary ways to create long-term returns in the stock market. The fundamental investment strategy is to buy a company stock trading for less than its intrinsic value, as calculated by one of several methods.
Its core philosophy is that its hard to know what makes stocks go up and down on a day to day basis, but in the long run – the market will recognize a stock’s intrinsic value.
Effectively, the stock is being underestimated by the market according to your calculations, as the price is less than its intrinsic value. You need to know how to evaluate a stock to come up with a price point that is attractive.
When you are studying value investing, there are many significant players that come through history. Warren Buffett is probably the best-known value investor today, but there are many others, including his professor and mentor Benjamin Graham.
These giants in value investing never followed the herd and are long-term investors of quality companies. Their concept is straightforward: know what you are buying and buy it on sale. This simple theory has led them to considerable investment success over the decades.
Philosophy of Value Investing
The value investor is interested in businesses and their fundamentals – no fancy AI models here. This would include such metrics as studying the earnings growth and earnings results, the dividends, company cash flow, and the tangible book value. There are other influences on the stock’s price that might not be as pertinent for the value investor.
Buy-and-hold investors are a classic example of value investors. They look for strong earnings growth, and they look for it over a very long period if possible. They buy stocks to hold for the long-term in order to see their undervalued stock’s price rise once the market corrects the pricing errors the investor took advantage of at the time of purchase.
Value investors reject the efficient-market hypothesis that states that share prices already take into account every single influencing factor on the price. They believe that there are opportunities to make money by identifying undervalued stocks by using intrinsic value.
While herd mentality can see a lot of investors spontaneously dumping their stock over insignificant short-term factors, value investors are confident in their ability to value a company well into the future so they’re able to remain calm in their decision to hold their stock through volatile markets. If you want to learn more about how to find the best value stocks, here’s a great article about value investing on Invezz.com
How to Calculate Intrinsic Value of a Stock
It’s easy to measure the book value of tangible assets such as equipment and buildings, but intellectual and intangible assets are more difficult to record and can’t be found on financial statements.
Value investors know that companies are more valuable than just their physical assets and so, expectations of a stock’s future growth and value are driven by this belief. Comparing a stock’s current trading price to its intrinsic value can show whether it’s under or over-priced
What exactly is the intrinsic value, and the question is how to value a stock?
Well, there are several different methods available on how to calculate intrinsic value of a stock, how to automate that intrinsic value of a stock, and also many ways on how to value a stock. When trying to decide what the true intrinsic value of a company is, it is possible to find a number of different values.
Investment firms usually work by finding several stock prices using different metrics, and they will take the average of their findings to apply to their stock models.
Intrinsic Value
Unfortunately, identifying stocks trading at less than their value isn’t as easy as purchasing shoes when they’re on sale. There is no advertising for stock prices. They have a current trading price and the rest is left up to analysis. So finding out how to calculate intrinsic value of a stock is important.
Intrinsic value is a measure of what a stock is worth. If the stock is trading at a price above intrinsic value, its overpriced; If its trading at a price below intrinsic value, it’s underpriced and essentially on sale.
To determine the intrinsic value of a stock, fundamental analysis is undertaken. Qualitative, quantitative and perceptual factors are all taken into account to build a valuation model.
Fundamental Analysis
Fundamental analysis consists of analyzing financial and economic factors relevant to a business’s performance. If you are wondering how to value a company a company stock, this is a great place to start.
Qualitative Factors
Qualitative factors are specific aspects relating to what a business does and how it is conducted. Such factors are unable to be measured. For example, company morale, governance, relationships with consumers, and business model.
Quantitative Factors
Quantitative factors are aspects that can be reliably measured regarding how well a business performs. This includes the business’s financial statements and various ratios and valuation metrics.
Perceptual Factors
Perceptual factors are derived by determining the expectations and perceptions of a stock that investors have.
All of these factors are put together as objectively as possible to build a mathematical model used for determining the intrinsic value of a stock. Obviously, there is still a level of subjectivity due to the nature of many of the qualitative factors and assumptions being made. After the intrinsic value is estimated, it is compared to the current market price of a stock to determine whether the stock is overvalued or undervalued.
Differences in valuation can arise as a result of individual analysts placing a higher weighting of importance on different factors. For example, a business’s management team might be held as a high value-determining factor when another analyst might place a higher weighting on profits as the driver of value.
The analyst weighting profits higher than management could wrongly discover an undervalued stock by focusing on steady profits but overlooking mismanagement of the company by the management team. In other words, their analysis shows the stock is undervalued according to the financial data they’ve looked at, but the trading price is low because the management team isn’t doing a very good job overall.
You can incorporate all the different types of measurement factors but ultimately the intrinsic value of a stock is still only an estimated value.
For private companies and pre-IPO stocks, sometimes perceptual factors are all you have to go on. To see an example of how to value and indirectly invest in a private company, check out how to buy Open AI stock.
Stock Ratios
There are some helpful ratios to know when trying to decide how to find the intrinsic value of a stock.
Financial analysis must be used to study a company’s financial performance, revenues, earnings, cash flow, and profit. Fundamentals such as their brand value, competitiveness, and future earnings must be estimated as well. The following metrics, however, are an excellent place to start.
Price-to-Book Ratio (P/B)
Also known as book value, this ratio looks at the value of the company’s assets and compares it to the current stock price. If the price is below that of the assets, the stock can be seen as undervalued. Read What is a Good P/E Ratio for a Stock? for more on P/E ratios.
Price-to-Earnings Ratio (P/E)
P/E is the most common ratio with the most significant following for valuation. It is calculated by looking at the stock price relative to the company’s earnings and is useful when compared to similar companies in the same industry. The lower the P/E ratio, the better, and the lower the ratio compared to related companies, the better. Value investors typically search for companies with P/E ratios in the bottom 10% of their sector.
Free Cash Flow (FCF)
FCF is more complicated to calculate but is generally available on a company’s financial report. Essentially, FCF is the cash generated from revenues after certain expenses are deducted, like operating expenses and capital expenditures.
These are the three metrics to concentrate on for intrinsic value calculations, but several others work as well. One can undoubtedly evaluate a stock on the company debt, equity, sales, and revenue growth as well. Also, if the company is ‘cheap’ enough relative to the competition, that could also be a compelling argument to buy.
In addition to these metrics, value investors want to see strong earnings growth over an extended period. They are looking in the range of 6-8% growth over a period of 7-10 years, where possible, and are looking to pay less than 70% of the calculated intrinsic value in order to capture the other 30%.
Stock Valuation Method 1: The Discounted Cash Flow Model (DCF)
When you want to value an entire company, a great way is to use the Discounted Cash Flow Model (DCF). The DCF will allow you to also value the company’s stock. The concept of the time value of money is used in the DCF model to value an entire company based on its future cash flows.
This calculation is applied by estimating all future cash flows and then discounting them by the cost of capital to derive the present value (PV) of all future cash flows. The Net Present Value (NPV) is the sum of all future cash flows, incoming and outgoing.
The DCF is calculated as follows:
Example from The Balance
Present value = [CF1 / (1+k)] + [CF2 / (1+k)2] + … [TCF / (k-g)] / (1+k)n-1]
- CF1: Cash flow year one
- CF2: Cash flow year two
- TCF: terminal cash flow, or the sum of final expected cash flows in perpetuity. After about 5 years, estimating can be tricky so this is used instead
- k: Discount rate or the required rate of return
- g: Expected growth rate
- n: number of years
Let’s apply this method to a fictional company. Calculating for 5 years into the future; the ‘k’ is 10% and the ‘g’ is 5%. You can calculate TCF in a number of ways, but we will use a method where the TCF is three times fifth year value
If we assume this company has a CF1 of $1 million today, discounting at 10% gets us a value of $909,000. Assumed discount rate is 10%.
In the following periods, we will apply a 5% growth to cash flow. The five year cash flows are as follows:
Year 2: $867,700
Year 3: $828,300
Year 4: $792,800
Year 5: $754,900
Terminal value will be 3 times the final Year 5 value, which comes to $2.265 million.
To reach the net present value, take the sum of these discounted cash flows ($909,000+$867,700+$828,300+$792,800+$754,900+$2.265 million) and you come to $6.41 million.
Based on this analysis, that’s the intrinsic value of the company.
But we want to value the shares, not just the company. One more small calculation is needed.
Assuming this company is publicly listed, trades at a price of $10, and has 500 thousand shares outstanding. Multiplying 500,000 * $10 gets you a market cap of $5 million. Because the value we calculated was more than that, the intrinsic value of the company is more than what it is currently trading at. Unless the stock is above $13, you would be willing to buy this company to gain what you see as a mistake by current market pricing, according to the DCF.
The DCF method is well-known for being a preferred method of valuation, but it does have its limitations.
Problems with DCF
Errors in Cash Flow Projections
Analysts often have a good idea of what operating cash flow will be for the current year and the following year, but beyond that, it gets increasingly more difficult the further into the future you try to predict. Cash flow projections are more often than not, based on the results of the preceding years.
Estimating years 1,2 and 3 might not be too much of a stretch but small errors in those early years make for huge errors in the estimation of years beyond that. It’s not uncommon for cash flow projections to be made for 10 years in the future and the analysis is going to be way out if small estimation errors occurred in year 2.
Cash flow can also be misleading in other ways. For example, a company could sell off a large amount of essential assets to generate a positive cash flow, but the business might not be able to operate without those assets.
Capital Expenditure Projections
Capital expenditures need to be projected for each year being modelled in the forecast of free cash flow. As we discussed in the point above, each additional year in the model increases the degree of uncertainty and can inflate small errors exponentially.
Capital expenditure can vary largely year to year depending on management or economic circumstances which makes assumptions extremely difficult to make.
Requires Accurate Data
As with all financial models, it’s only as good as the data entered. If the metrics and estimations don’t closely reflect reality, then the end result is not going to give an accurate valuation.
Stock Valuation Method 2: The Dividend Discount Model (DDM)
The DDM is another absolute value model that is very commonly used to value stocks.
Stocks are valued based on the net present value of the future dividends. The theory behind this method is that a stock is valued as the sum of all its future dividend payments combined. These dividend payments are then discounted back to their present value.
If the value obtained from the DDM is higher than the current trading price of shares, then the stock is undervalued or essentially “on sale”.
With DDM, there are two simple versions to determine what the required rate of return is. The required rate of return is essential to determining the shareholder value.
Example from The Balance
Stock value = Dividend per share / (Required Rate of Return – Dividend Growth Rate)
Rate of Return = (Dividend Payment / Stock Price) + Dividend Growth Rate
These are easy formulas once getting the terminology down:
Stock Price: Last traded price of the company in the public market
Annual Dividend Per Share: the total amount of dividends received in a year, per share outstanding
Dividend Growth Rate: as companies increase their dividend, sometimes quite often, this is a measure of the average growth rate of that dividend
Determining Required Rate of Return: This might also be referred to as the cost of equity. This return rate is the minimum amount required to be investing in a company’s shares. In effect, the return needed to take on the risk.
Generally, the DDM is most efficient for larger, more mature companies. This is because of the consistency and predictability of cash flows and dividends for those types of companies.
Some larger companies have paid dividends for over a hundred years, consistently, and have raised them over time. That is a great example of a company where DDM is a great model to use.
1. Required Rate of Return
The first factor that needs to be determined is the rate of return.
Rate of Return = (Dividend Payment / Stock Price) + Dividend Growth Rate
An example of company XYG will show how this works:
XYG is trading at $50 per share. The annual dividend is projected to be $2.56. XYG has an average dividend growth rate of 6% per annum.
Calculating the rate of return for XYG is as follows:
($2.56/50) + .06 = 11.12%
Based on the current price, an annual return of 11.12% can be expected.
2. Determining Correct Shareholder Value
If you’re looking for the value of a stock, you can manipulate this formula:
Stock Value = Dividend per share / (Required Rate of Return – Dividend Growth Rate)
XYG then becomes:
$2.56 / (0.1112 – 0.06) = $50
Sometimes, however, investors require to be compensated higher. For example, if an investor wants to get 15% a year return, there will be a price which that investor finds this company attractive. Calculating for a 15% required return:
$2.56 / (0.15 – 0.05) = $25.6
You would need XYG to drop to $25.6 before investing in the company, given that you want 15% returns. If you require less return, you could buy at a higher price.
Applying Stock Valuation Methods In Your Investing
As you can see, there are a lot of concepts to grasp when it comes to value investing. Whilst the concepts are fairly easy to understand, putting them into practice with real money isn’t always so easy.
The psychological preference of humans is to follow the crowd, so when it seems that everyone is dumping their shares in a company and prices start to fall, it’s hard for many to look at it rationally.
Value investors are able to analyze the fundamentals, keep calm and decide for themselves if it’s a stock worth having. Historically speaking, this investment philosophy has been a great way to perform well in the stock market.
You can screen for stocks using these valuation methods and other metrics, using a stock screener. We’ve published a list of the best stock screeners here.
You may also like this review of the best fundamental analysis tools or this one on how to predict stocks. And if you’re interested in those, learn how to use analyst stock ratings or the best time to buy stocks.